Industry standards, what drives acceptance vs. decline, and compensation strategy for hourly workers.
Offer Acceptance Rate Benchmarks by Industry
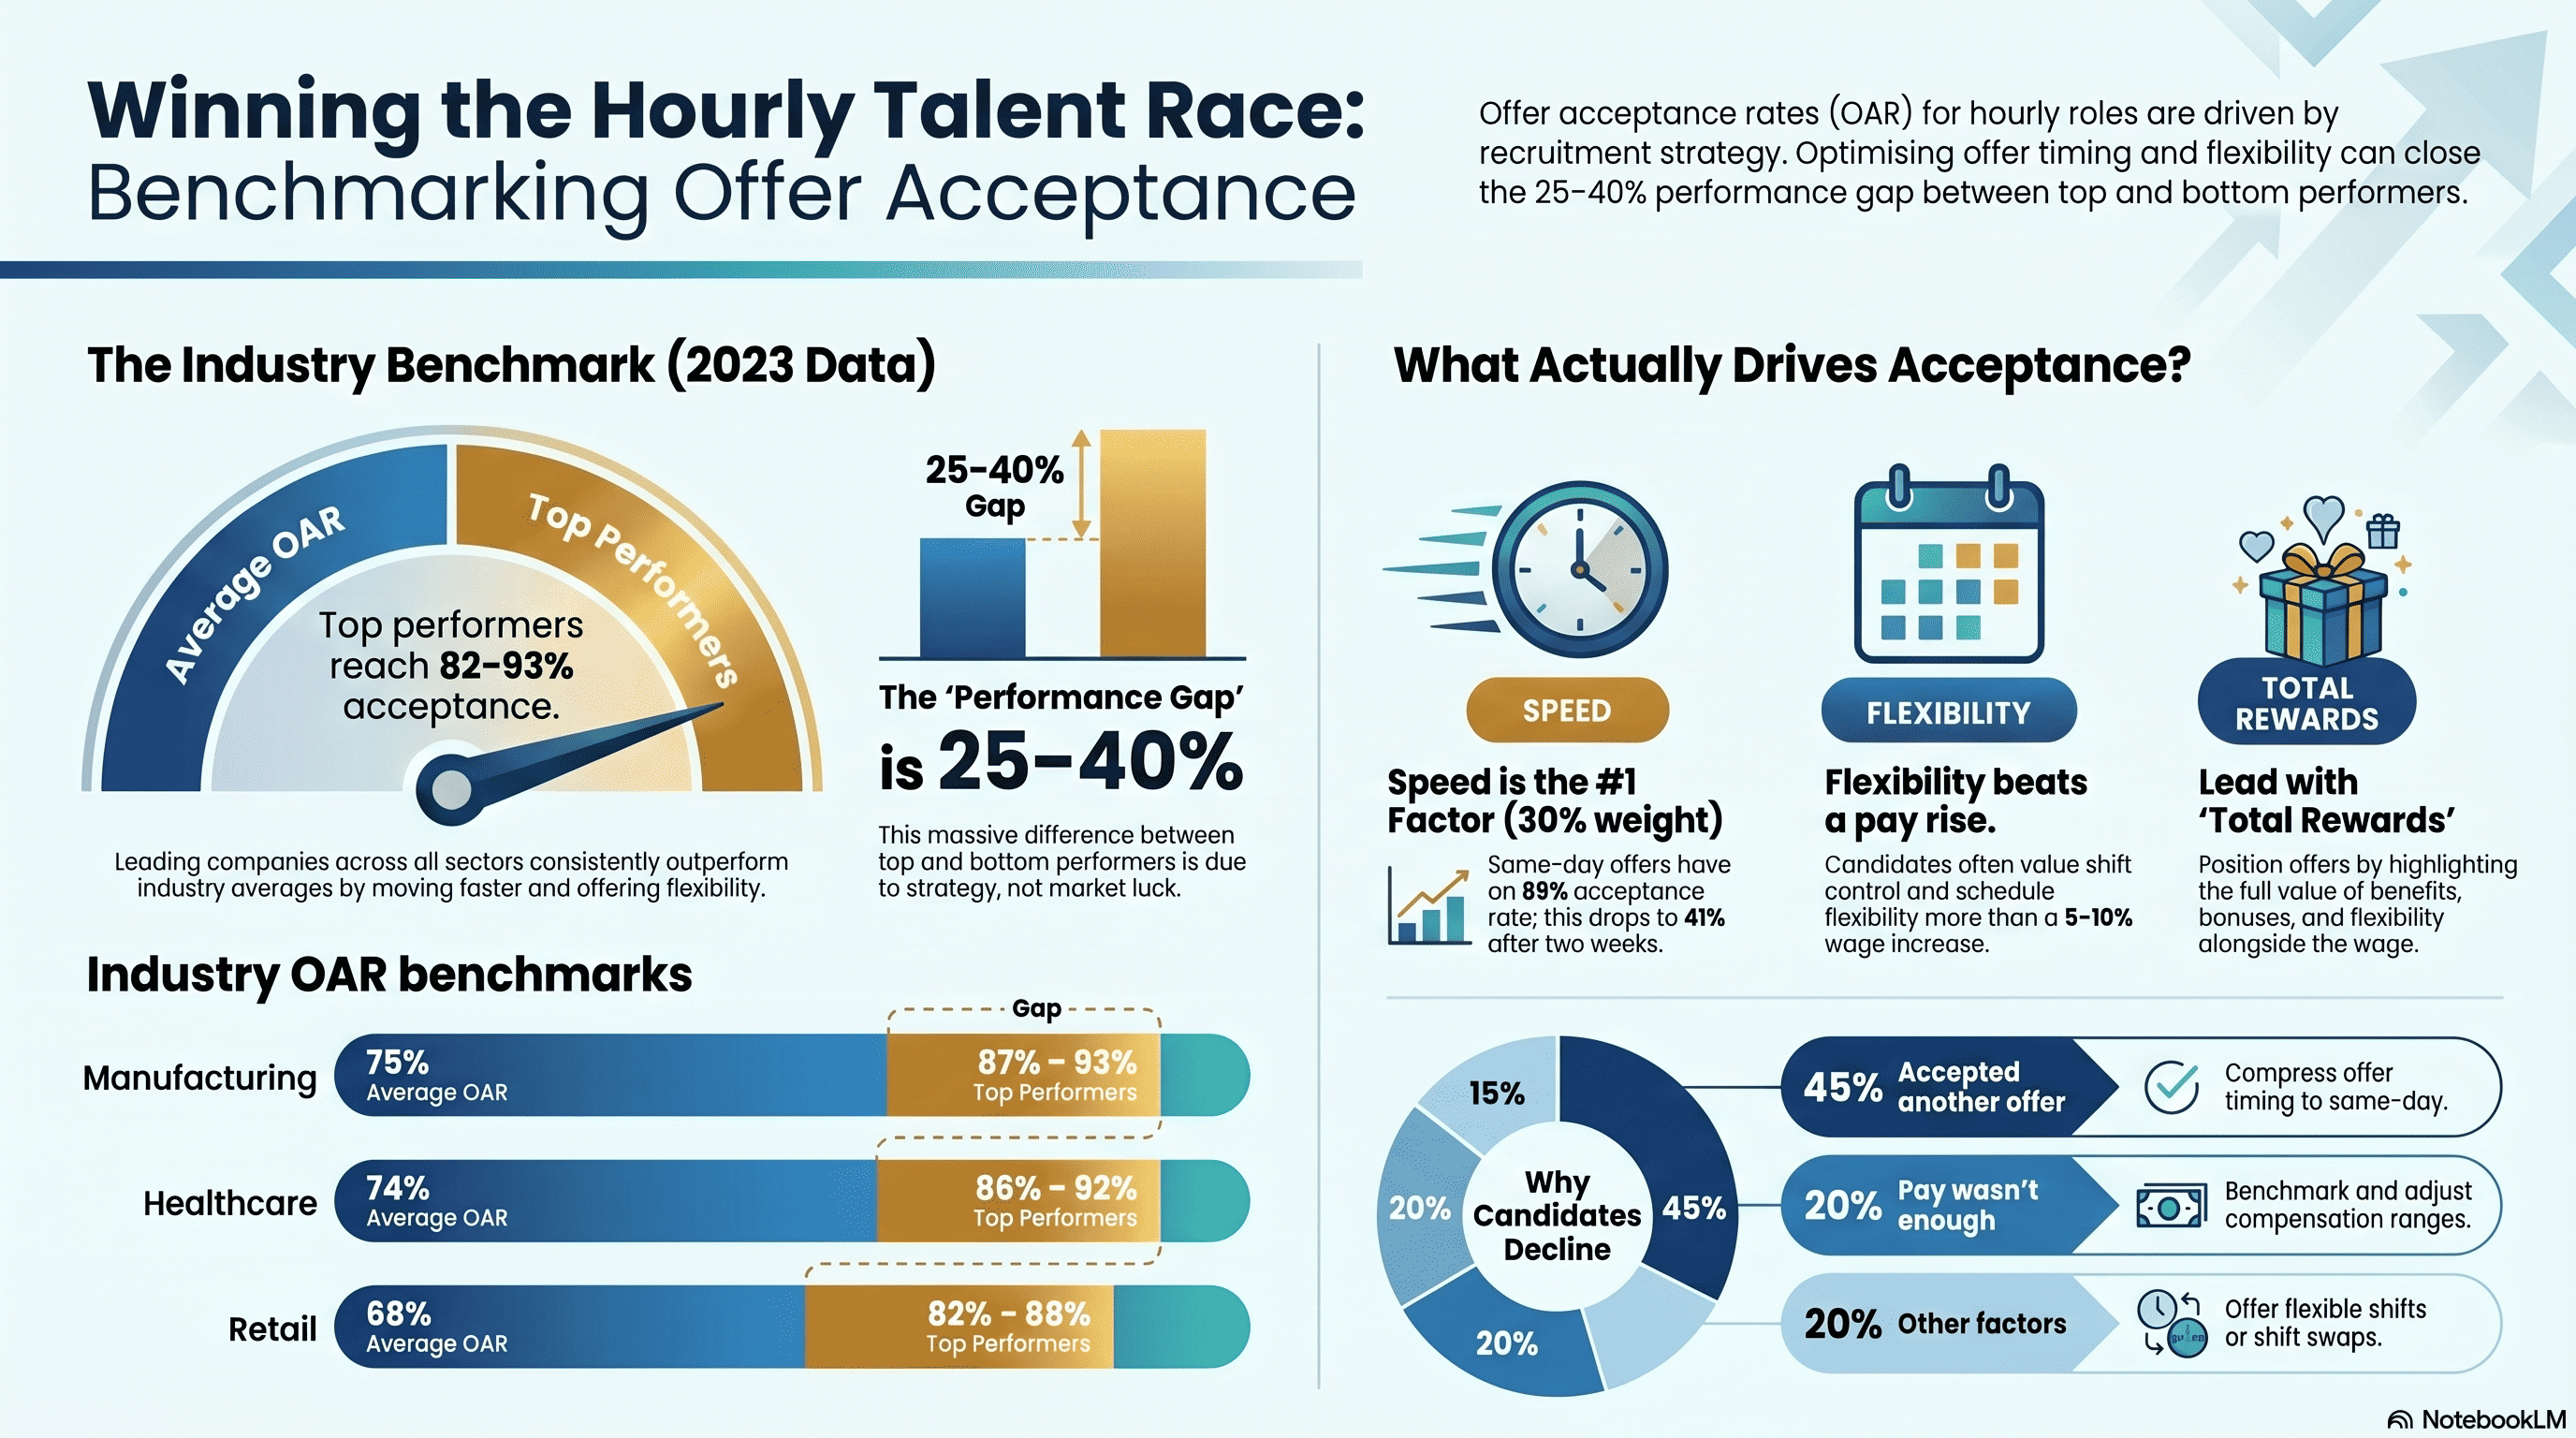
Offer acceptance rates vary significantly by industry. Understanding where you stand relative to benchmarks is critical for diagnosis and improvement.
National benchmarks (2023 data):
Retail:
- Industry average: 68%
- Top performers: 82-88%
- Bottom performers: 45-55%
Hospitality/Food Service:
- Industry average: 62%
- Top performers: 78-85%
- Bottom performers: 40-50%
Warehouse/Logistics:
- Industry average: 71%
- Top performers: 85-91%
- Bottom performers: 50-62%
Healthcare:
- Industry average: 74%
- Top performers: 86-92%
- Bottom performers: 58-70%
Manufacturing:
- Industry average: 75%
- Top performers: 87-93%
- Bottom performers: 60-72%
Key insight: There’s a 25-40 percentage point gap between top performers and bottom performers in the same industry. This gap isn’t about market conditions; it’s about recruiting strategy.
Top performers (82-93% acceptance) aren’t paying significantly more. They’re moving faster, communicating better, offering more flexibility, and selecting better-fit candidates.
Bottom performers (40-55% acceptance) aren’t in a worse market. They’re making strategic mistakes: slow offer timing, poor candidate fit, unrealistic job descriptions, compensation misalignment.
What Drives Acceptance vs. Decline
Research on offer acceptance asks: why do candidates accept or reject offers?
Factors driving acceptance (in order of importance):
#1: Offer timing (30% weight)
- Accepted same-day: 89% acceptance rate
- Accepted in 2-3 days: 78% acceptance rate
- Accepted in 4-7 days: 62% acceptance rate
- Accepted in 8-14 days: 41% acceptance rate
Speed matters more than anything else. Fast offers get accepted; slow offers get declined.
#2: Compensation competitiveness (25% weight)
- Market rate offered: 78% acceptance rate
- 5-10% above market: 85% acceptance rate
- 5-10% below market: 52% acceptance rate
- 10%+ below market: 28% acceptance rate
Competitiveness matters. But matching market rate is sufficient; you don’t need to exceed market. And slow offer at high pay loses to fast offer at market rate.
#3: Schedule flexibility (20% weight)
- Flexible scheduling offered: 82% acceptance rate
- Fixed schedule: 61% acceptance rate
- Shift preference accommodated: 86% acceptance rate
For hourly workers, schedule flexibility is highly valued. Candidates with kids, transportation constraints, or second jobs prioritize schedules that fit their life.
#4: Role clarity (15% weight)
- Clear role description with expectations: 75% acceptance rate
- Vague description: 48% acceptance rate
- Job changed from description during interview: 31% acceptance rate
Candidates accept when they understand the role. Misalignment causes decline.
#5: Company/culture fit (10% weight)
- Strong connection with hiring manager: 80% acceptance rate
- Weak connection: 60% acceptance rate
- Perceived negative culture: 35% acceptance rate
Fit matters but is least important. Speed, pay, schedule, clarity matter more.
Major reasons for decline:
“I accepted another offer” (45% of declines)
Candidate received competing offer while waiting for yours. Prevented by: fast offer timing.
“The pay wasn’t enough” (20% of declines)
Offer was below candidate’s expectations. Prevented by: compensation benchmarking.
“The schedule doesn’t work” (15% of declines)
Offerred schedule doesn’t fit candidate’s life. Prevented by: flexible scheduling or schedule discussion during interview.
“I learned more about the role and it’s not what I want” (12% of declines)
Role expectations weren’t clear during interview. Prevented by: realistic job preview, clear role description.
“The company culture seemed negative” (5% of declines)
Candidate picked up on team dysfunction or poor management. Prevented by: positive hiring manager presence, honest culture discussion.
“I’m still exploring other options” (3% of declines)
Candidate isn’t committed yet. Prevented by: interviewing only serious candidates, phone screen qualification.
Compensation Strategy for Hourly Workers: Competitive Positioning
Compensation is one component of offer acceptance, but it’s often over-indexed (recruiters focus too much on pay, not enough on timing/flexibility).
Compensation competitiveness strategy:
Market rate benchmarking:
Know what competitors are paying for each role in your geography.
Retail cashier, US average: $14.50/hr
- Target range: $14.00-$15.50/hr (matching to 7% above market)
- This range is competitive and attracts quality candidates
- Candidates at top of range ($15.50) feel like they’re paid fairly; candidates at bottom ($14.00) feel undercut
Warehouse associate, US average: $17.50/hr
- Target range: $17.00-$19.00/hr
- This positions you competitively
Strategy: Market-rate positioning
Compete on rate being “fair and transparent” not necessarily highest. In one study:
- Company A paid $16/hr (top of market) with slow (6-day) hiring: 68% acceptance rate
- Company B paid $15.50/hr (market rate) with fast (same-day) hiring and flexible schedule: 84% acceptance rate
- Company C paid $15.00/hr (5% below market) with slow hiring and rigid schedule: 42% acceptance rate
Company B won on non-compensation factors despite paying 3% less than Company A.
Geographic variation:
Compensation varies by cost-of-living:
Retail cashier:
- San Francisco: $17-19/hr (COLA premium)
- Austin: $15-16/hr (moderate)
- Rural South: $13-14/hr (lower COLA)
Use COLA data to adjust ranges by geography. Paying $14/hr in San Francisco is not competitive; paying $18/hr in rural South is over-market.
Experience-based variation:
Within roles, compensation varies by experience:
Warehouse associate:
- 0-6 months experience: $17.00/hr
- 6-12 months experience: $17.75/hr
- 1-2 years experience: $18.50/hr
- 2+ years experience: $19.00/hr
Experience bands ensure fairness (everyone at same experience level gets similar pay) while allowing growth.
Total rewards packaging:
Compensation isn’t just wage. For hourly workers, total rewards include:
- Hourly wage (primary)
- Shift premium (extra pay for graveyard shifts, weekends)
- Bonus opportunity (quarterly or annual bonus for performance)
- Health benefits (health, dental, vision)
- Paid time off (vacation, sick, personal days)
- 401k matching
- Flexible schedule
- Tuition reimbursement
- Referral bonus ($500-2,000 if employee refers someone who gets hired)
- Free meals (hospitality)
- Discounts (employee discount on products)
Total rewards for a $16/hr warehouse position might be:
- Base wage: $16/hr = $33,280 annually
- Health benefits: $3,000 value
- Shift premium: $1,000 (for graveyard shifts)
- Paid time off: $1,600 (80 hours at $20/hr average)
- 401k match: $800
- Referral bonus opportunity: $250 average
- **Total compensation: $40,000 value**
When positioned correctly (“$16/hr plus $7,000 in benefits and bonuses”), total compensation looks significantly better than wage-only positioning.
Flexibility as compensation:
For hourly workers, schedule flexibility is often valued more than 5-10% pay increase:
- “We’ll work around your second job” > “$1/hr more”
- “Shift swaps available” > “$1/hr more”
- “No mandatory scheduling 6 months out” > “$1/hr more”
Flexibility costs the company minimal financial impact but is valued highly by candidates, especially single parents, students, and people with transportation constraints.
The Total Rewards Conversation: Positioning Your Offer
How you present the offer dramatically affects acceptance. Same offer can be accepted 65% of the time or 85% of the time based on how it’s positioned.
Poor positioning:
“We’re offering $16/hour for the warehouse associate position. Your start date would be Monday.”
Candidate’s reaction: “That’s not much more than my current job. Let me think about it.”
Acceptance rate: 58%
Good positioning:
“We’re excited to offer you the warehouse associate position at $16/hour. Here’s the complete package:
- Base wage: $16/hour
- Shift flexibility: You set your own schedule (we have day, evening, overnight shifts available—you choose)
- Health benefits: Health, dental, vision insurance (company pays 80%)
- Paid time off: 15 days annually
- 401k match: Company matches 3% of contributions
- Bonus opportunity: Performance bonus up to $2,000 annually
- Advancement: Fast-track to lead roles within 12 months for top performers
Start date: Monday, April 17″
Candidate’s reaction: “Wow, that’s comprehensive. Great benefits, and I get schedule control. Yes, I’m in.”
Acceptance rate: 84%
Key elements of good positioning:
- Lead with role excitement (not just wage)
- Show total rewards, not just wage
- Highlight flexibility/benefits that matter to this candidate
- Make clear path to advancement
- Show urgency (specific start date) without pressure
Customization by candidate:
Personalize what you highlight based on candidate priorities (gathered during interview):
Candidate with kids: “Schedule flexibility means you can do school pickup/drop-off. We have morning shifts (5am-2pm) that fit school schedules.”
Candidate with transportation issues: “We’re close to the bus line and have easy parking. Many associates use public transit.”
Candidate wanting to go back to school: “We have tuition reimbursement ($2,000/year) and flexible scheduling that works with class times.”
Candidate motivated by career growth: “Our promotion rate is X—many associates move to supervisory roles within 18-24 months. Here’s the path: Associate → Lead → Supervisor → Manager.”
Customization doesn’t cost more; it’s just repositioning the offer to match candidate values.
Measuring Acceptance Rate and Diagnosing Decline Reasons
Acceptance rate metric:
- Definition: Offers extended / Offers accepted
- Measurement: Track in your ATS
- Benchmark: 70%+ is good, 75%+ is excellent, 60-70% is concerning
Acceptance rate by role and department:
Track separately by role to identify which positions have acceptance issues.
Example monthly data:
- Cashier: 82% acceptance (excellent)
- Sales associate: 76% acceptance (good)
- Shift supervisor: 68% acceptance (concerning)
- Store manager: 55% acceptance (poor)
If shift supervisor is only 68%, investigate. Are you paying below market? Is the schedule inflexible? Are candidates connecting with hiring manager?
Decline reason tracking:
When candidates decline, ask why: “Thanks for considering the role. Can we ask why you’re declining the offer?”
Track responses in your ATS:
- “Accepted another offer”
- “Pay not enough”
- “Schedule doesn’t work”
- “Role unclear/different than expected”
- “Want to explore other options”
- “Company culture concern”
- “Personal reasons”
- “Other”
Analysis:
If 40% of declines are “accepted another offer,” your issue is timing. Compress offer timing from 5 days to same-day.
If 30% are “pay not enough,” your issue is compensation. Benchmark and adjust ranges.
If 25% are “schedule doesn’t work,” your issue is flexibility. Offer more scheduling options.
Action planning:
Once you identify the decline driver, build corrective action:
If timing is the problem:
- Implement pre-approved ranges
- Deploy same-day offer automation
- Target: 80%+ acceptance (from 65%)
- Timeline: 6-8 weeks to full implementation
If compensation is the problem:
- Benchmark against competitors
- Adjust ranges (increase by 5-10%)
- Position total rewards better
- Target: 78%+ acceptance
- Timeline: Immediate (ranges can adjust within weeks)
If schedule is the problem:
- Offer flexible scheduling
- Introduce shift swaps
- Allow candidate to choose preferred shifts
- Target: 80%+ acceptance
- Timeline: 2-4 weeks to implement flexible scheduling system
If role clarity is the problem:
- Create realistic job preview
- Show video of person doing the role
- Have candidates shadow someone for 30 minutes
- Clarify expectations and day-to-day reality
- Target: 82%+ acceptance
- Timeline: 4-6 weeks to create materials
Benchmarking against industry:
If you’re at 65% acceptance and industry average is 70%, you’re 5 points below. That’s fixable. If you’re at 40% acceptance and industry is 70%, you have a major problem (timing, pay, schedule, or culture issue).
Use industry benchmarks as motivation. “We’re hiring 50 people/month. At 65% acceptance, we’re extending 77 offers. At 80% acceptance, we’d extend 63 offers for same hires. That’s 14 fewer offers to manage and 25% fewer declined candidates.”
References and Further Reading
- Society for Human Resource Management, “Offer Acceptance Rate Benchmarks by Industry,” 2023
- LinkedIn, “What Drives Offer Acceptance in Hourly Roles,” 2023
- Bureau of Labor Statistics, “Compensation Benchmarks by Industry and Geography,” 2024
- Glassdoor, “Total Rewards Perception and Offer Acceptance,” 2023
- Cadient Talent SmartSuite Case Study, “Total Rewards Positioning Impact on Acceptance,” 2024
- Harvard Business Review, “Hourly Worker Compensation Strategy,” 2023
- Mercer, “Total Rewards Strategy for Frontline Workers,” 2023
How Cadient Talent SmartSuite™ Helps
Cadient Talent’s SmartSuite™ platform automates compliance workflows, embeds regulatory guardrails directly into your hiring process, and maintains audit-ready documentation at every stage—so your team can focus on finding great talent while staying protected from costly violations.