
Recruiting Funnel Mastery: Stages, Math & Real‑World Optimization
The Brutal Truth About Recruiting Funnels
Most talent teams think they’ve nailed the hiring process until the numbers scream otherwise. The truth? You’re probably losing half the candidates before they even see your job ad. That’s why a recruiting funnel isn’t a nice diagram you hang on the wall – it’s the lifeblood of high‑volume hiring.
And if you can’t see where the drop‑offs happen, you can’t fix them. The funnel gives you a mirror, a map, and a scoreboard all in one.
The Five Stages of the Recruiting Funnel
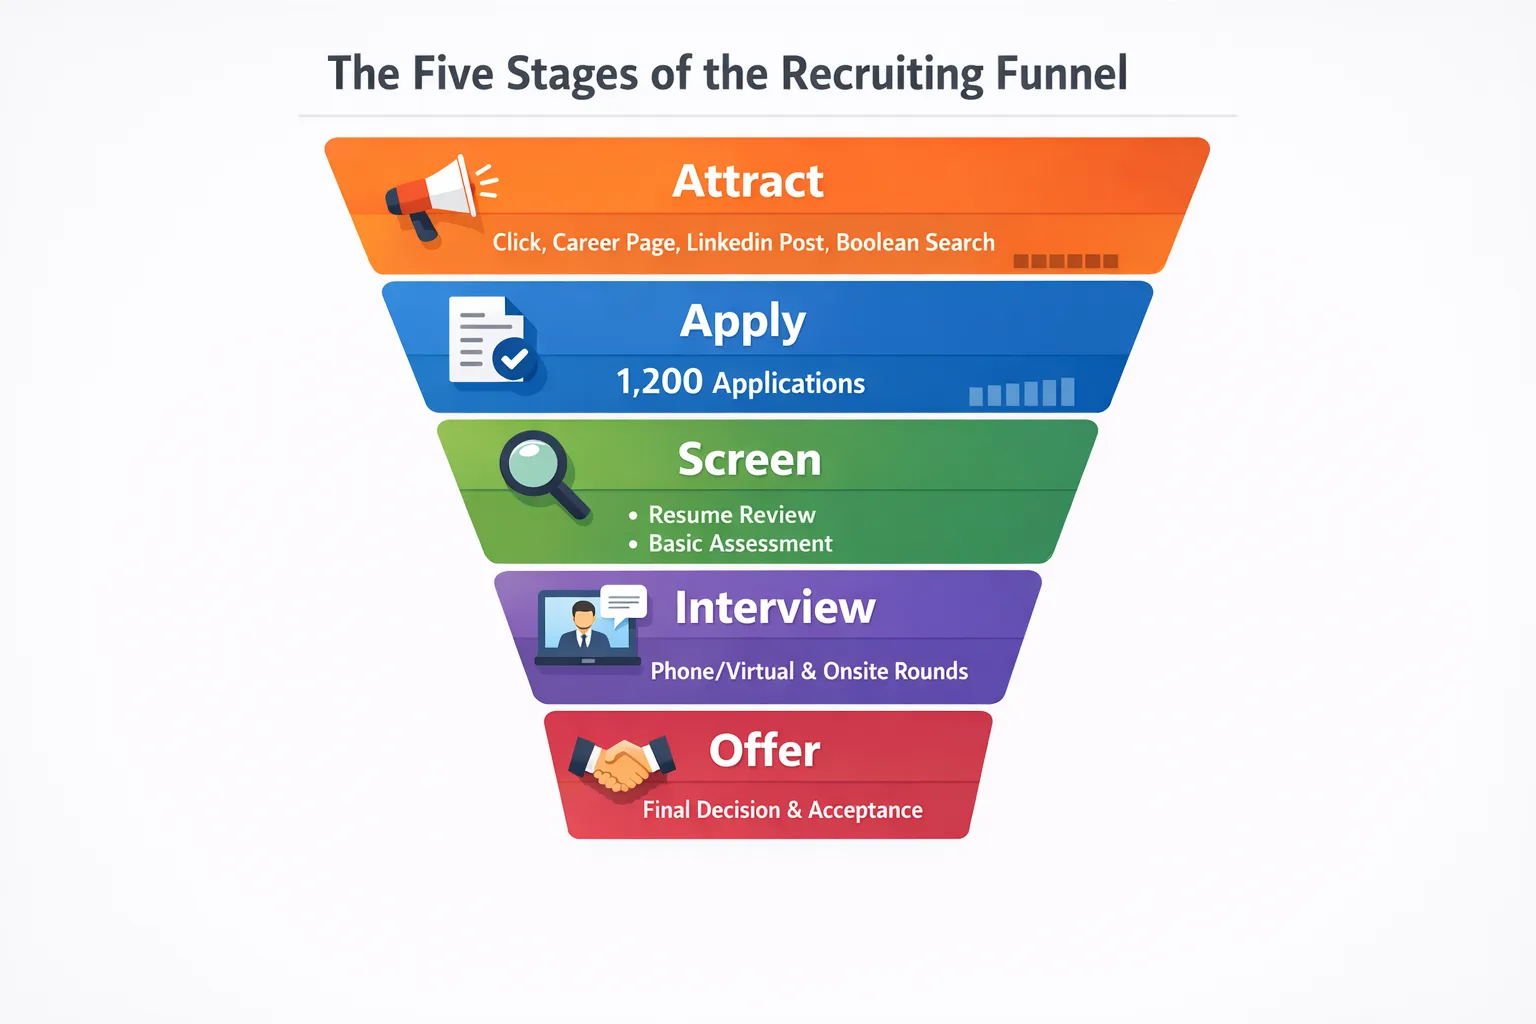
Stage 1 Applications
Everything starts with a click. Candidates land on your career page, reply to a LinkedIn post, or are sourced through a Boolean search. The raw count here is the applicant pool. For a mid‑size tech firm, that number can balloon to 1,200 applications for a single software engineer role.
But raw volume means nothing without a way to sift through it. That’s why you need a clear intake form, pre‑screening questions, and a simple tag system in your ATS.
Stage 2 Screenings Completed
Screenings are the first real filter. Phone screens, video assessments, or automated skill tests whittle the pool down to the candidates who meet the baseline criteria. In our example, only about 15% – roughly 180 people – move past this gate.
Now you can start measuring funnel efficiency. If you’re only seeing 5% move forward, something’s off in your sourcing strategy.
Stage 3 Interviews Scheduled
At this point, recruiters are juggling calendars. The goal is to get qualified candidates in front of hiring managers fast. A healthy interview‑schedule rate hovers around 10% of the original applications. That means 120 interviews set in our running example.
And if your time‑to‑schedule spikes past two weeks, you risk losing top talent to a competitor’s faster process.
Stage 4 Offers Extended
Offers are the culmination of the interview marathon. Expect about 30% of scheduled interviews to translate into an offer – so roughly 36 offers in our scenario.
Here’s where the applicant‑to‑hire ratio starts to become crystal clear. If you’re extending 36 offers and only hiring 18, you’ve got a 2:1 conversion rate at this stage.
Stage 5 Offers Accepted / Hires
The final stage is the moment you’ve been working toward: a signed contract. Industry benchmarks for full‑time roles sit near a 50% acceptance rate, leaving you with about 18 new hires.
Now you can compare that 18 to your original hiring goal. If you needed 30 engineers, the funnel tells you you have to boost the top of the funnel or tighten the drop‑off percentages.
The 180-to-1 Math in Action
Ever heard the 180‑to‑1 rule? It’s a quick way to visualize how many applications you need to land a single hire. In our case, 1,200 applications produced 18 hires – that’s a 66‑to‑1 ratio, not 180‑to‑1. The rule is a reminder that for many niche roles, you might really need 180 resumes to fill one seat.
Calculate it yourself: take your total applications, divide by hires, and you have your funnel ratio. If you’re seeing a ratio above 150, you’re probably over‑screening or sourcing from the wrong places.
Why Most Companies Get the Funnel Wrong
Most firms treat the funnel like a sales pipeline, copying terminology but ignoring the human element. They focus on “lead conversion” instead of “candidate experience.” The result? High dropout rates at the screening phase.
- They don’t track the “applications to screen” metric, so they can’t see a 70% leak.
- They rely on manual spreadsheets, which miss real‑time changes.
- They forget to align sourcing strategy with each funnel stage – posting on a generic job board when you need niche talent.
And when you finally look at the data, you’re blindsided by a cost‑per‑applicant that’s spiraling.
Calculating Your True Funnel Ratio
Grab a piece of paper or open a spreadsheet. List each stage, plug in your numbers, and divide the top number by the bottom. Here’s a quick example:
| Stage | Count |
|---|---|
| Applications | 1,200 |
| Screenings Completed | 180 |
| Interviews Scheduled | 120 |
| Offers Extended | 36 |
| Offers Accepted | 18 |
Now calculate each conversion: Applications → Screenings is 15%, Screenings → Interviews is 67%, and so on. If any conversion falls below industry hiring benchmarks – say 20% for interviews from screens – you’ve identified a bottleneck.
The Cost‑Per‑Applicant Analysis
Cost‑per‑applicant (CPA) isn’t just the ad spend. It includes recruiter hours, ATS fees, assessment tools, and even the cost of a missed hire. Let’s break it down for a typical tech hiring drive:
- Job board spend: $2,500
- Recruiter time (30 hrs @ $45): $1,350
- Assessment platform: $1,200
- ATS subscription share: $800
Total spend: $5,850. Divide that by 1,200 applications and you get a CPA of $4.88. Not terrible, but if you’re only hiring 18, the cost‑per‑hire skyrockets to $325.
Now, slice the CPA by source. LinkedIn might be $6 per applicant, while employee referrals drop to $1. That insight lets you re‑budget toward the most efficient channels.
Using Funnel Math to Set Realistic Hiring Goals
Goal‑setting without numbers is guesswork. Suppose your senior leadership wants 50 new engineers in the next quarter. With a 66‑to‑1 ratio, you’ll need roughly 3,300 applications. That translates to a daily target of about 110 applications for a 30‑day hiring window.
But if you can improve your screening conversion to 20% (instead of 15%), the ratio improves to about 50‑to‑1, slashing the required applications to 2,500. Funnel math shows you exactly where to push for efficiency.
The Funnel as Your Hiring North Star
Think of the funnel as the compass that keeps your hiring ship on course. When you track each stage, you can spot a slowdown before it becomes a crisis. Use dashboards that visualize each metric, set alerts for conversion dips, and hold weekly “funnel reviews” with recruiters, hiring managers, and finance.
And the best part? The funnel doesn’t just tell you what’s happening; it tells you why. A dip in interview scheduling often points to calendar chaos, not a lack of talent.
Recruitment Funnel vs Sales Funnel
Both funnels share the idea of narrowing a large pool to a few high‑value outcomes. The sales funnel focuses on revenue; the recruiting funnel focuses on talent. The key difference is the emotional journey. Candidates need reassurance, timely feedback, and a clear employer brand at every step.
In practice, you can borrow sales metrics like “conversion rate” but you must add candidate experience scores – a KPI most sales teams ignore.
Common Pitfalls and How to Avoid Them
- Over‑reliance on ATS reports – they’re only as good as the data you feed them. Regular data hygiene is a must.
- Ignoring source quality – track CPA by channel; drop the spend on low‑yield boards.
- Skipping the screening audit – a 5‑minute audit each week can surface ambiguous criteria that cause drop‑offs.
- Setting hiring goals without funnel capacity – always reverse‑engineer from hires to applications.
Key Performance Indicators and Benchmark Data
Here are the top KPIs every recruiting leader should watch:
- Application‑to‑Screen conversion (industry average 12‑18%)
- Screen‑to‑Interview conversion (average 55‑70%)
- Interview‑to‑Offer conversion (average 30‑40%)
- Offer‑to‑Acceptance rate (average 45‑55%)
- Time‑to‑Fill per stage (benchmark: 5 days for screen, 7 days for interview)
Compare your numbers against these benchmarks. If you’re lagging on any, it’s a red flag to dig deeper.
Technology Stack Overview
Modern recruiting funnels run on a mix of tools:
- ATS – core for tracking applications and stages.
- Recruitment marketing platforms – push content, capture candidates, and feed the top of the funnel.
- Assessment suites – automate screen filtering and improve quality.
- Analytics dashboards – visualize conversion rates in real time.
And don’t forget integration. An API that pushes data from your job board into the ATS eliminates manual entry errors that skew your funnel math.
Real‑World Case Study
Let’s look at a fast‑growing e‑commerce startup that needed 100 warehouse associates in three months. Their initial funnel looked like this:
- Applications: 4,500
- Screenings: 300 (7% conversion)
- Interviews: 250 (83% of screened)
- Offers: 120 (48% of interviewed)
- Hires: 92 (77% acceptance)
Problem: The screen conversion was abysmal. By adding a short video‑assessment and tightening the job ad keywords, they bumped screen conversion to 15%, resulting in 675 screened candidates. That change alone added 28 extra hires, pushing them past their goal.
The lesson? Small tweaks at the top of the funnel can ripple through to the bottom, saving both time and money.
Funnel Efficiency Optimization Checklist
Quick wins you can implement this week:
- Applications: Optimize job titles for SEO; add clear role specifics to boost qualified traffic.
- Screenings: Deploy a 5‑question pre‑screen that eliminates 30% of unqualified resumes outright.
- Interviews: Use a shared calendar link to reduce scheduling friction by 40%.
- Offers: Send e‑signatures within 24 hours; include a personalized video from the future manager.
- Hires: Assign a buddy before Day 1 to improve acceptance and early retention.
Interactive Funnel Math Calculator Walkthrough
Imagine a spreadsheet with four columns: Stage, Target Hires, Conversion Rate, Required Applicants. Here’s a step‑by‑step:
- Enter your hiring goal – e.g., 25 engineers.
- Input benchmark conversion rates: 15% for screen, 60% for interview, 35% for offer, 50% for acceptance.
- The calculator back‑calculates: you’ll need 1,666 applications to meet the goal.
- Adjust any conversion rate up or down, and the required applications instantly update.
This live model helps you argue for more sourcing budget or for process improvements with hard numbers, not vague feelings.
Integrating Recruitment Marketing Automation with Funnel Metrics for Continuous Improvement
Automation isn’t just about posting jobs. It’s about feeding the funnel with the right talent at the right time. Set up triggers such as:
- If screen conversion drops below 12%, automatically launch a targeted ad boost on niche sites.
- When offer acceptance falls under 45%, send a personalized email sequence that shares employee testimonials.
- Link assessment scores to ATS tags, so high‑scorers move straight to interview scheduling.
By closing the loop between marketing automation and funnel data, you create a self‑correcting system. The metrics tell the bot when to act, and the bot fuels the funnel with fresh candidates.
High‑Volume Hiring Considerations
When you’re staffing a call‑center or a retail chain, every stage must be scalable. Batch screening, group video interviews, and automated offer letters become essential. Funnel ratios tend to flatten – you might see a 200‑to‑1 application‑to‑hire ratio, but you can offset that with bulk efficiencies.
Don’t forget to monitor the applicant‑to‑hire ratio per source. A university career fair might bring 300 applicants but only 2 hires, whereas a specialized forum yields 50 applicants and 12 hires.
Applicant‑to‑Hire Ratio and Its Impact on Staffing Plans
If your ratio spikes, your budget will explode. A 250‑to‑1 ratio for a seasonal retail role means you’ll need $0.30 CPA to stay under a $75 k hiring budget for 300 hires. Either you cut costs or you improve conversion – the math is unforgiving.
Funnel Efficiency and Bottleneck Identification
Plot each stage on a chart and look for the steepest slope. That’s your bottleneck. In most companies, it’s the screening stage, because manual resume reviews are slow and inconsistent. Invest in AI‑driven parsing to shave minutes off each review, and you unlock dozens of extra candidates per week.
Cost‑Per‑Applicant Calculation Methods
Two approaches work well:
- Top‑Down: Total spend ÷ total applications.
- Bottom‑Up: Add up channel‑specific spend (ads, referrals, events) and divide by applicants sourced from each channel.
Bottom‑up gives you the granularity to shift budget from a $10 CPA source to a $2 CPA one, dramatically improving overall funnel ROI.
Funnel Math Fundamentals
Remember the simple equation: Applicants × (Screen % × Interview % × Offer % × Acceptance %) = Hires. Plug in your numbers, and you instantly see the impact of a 5% improvement at any stage.
Hiring Benchmarks by Industry and Role Level
Here’s a quick snapshot:
- Tech entry‑level: 180‑to‑1
- Healthcare senior: 80‑to‑1
- Retail hourly: 250‑to‑1
- Executive: 35‑to‑1
Use these as a baseline. If your numbers are worse, you need to revisit your sourcing strategy or tighten your qualifications.
Sourcing Strategy Alignment with Funnel Stages
Each stage benefits from a different sourcing mix:
- Top of Funnel: Broad job boards, social media ads, employee referrals.
- Mid Funnel: Niche forums, talent pools, targeted outreach.
- Bottom Funnel: Direct recruiter outreach, personalized messaging, and salary benchmarking.
Align your budget accordingly, and watch the conversion percentages climb.
Using Hiring Goals to Shape Funnel Capacity
Set your hiring goals first, then reverse‑engineer the funnel capacity needed. If you need 40 data analysts in six months, and your historical conversion is 1‑to‑150, you’ll need at least 6,000 applications. That number informs your ad spend, your recruiter headcount, and your technology needs.
Visualizing Funnel Data in Dashboards
Dashboards don’t have to be boring. Use color‑coded bars for each stage, and add a trend line that shows month‑over‑month conversion changes. Include a “cost per hire” widget that updates in real time as spend data rolls in.
Now anyone from the CFO to the hiring manager can see the funnel’s health at a glance.
Continuous Improvement Loop
Measure → Analyze → Adjust. That’s the mantra. Every week, pull the latest funnel metrics, note any dip, ask “why,” and implement a fix. Then measure again. Over time, those incremental tweaks add up to a dramatically more efficient hiring engine.
Bottom Line
Mastering the recruiting funnel isn’t a one‑time project; it’s a daily habit. By breaking the process into five clear stages, applying the 180‑to‑1 math, and constantly sharpening your funnel efficiency, you’ll turn vague hiring goals into predictable outcomes. Remember to track cost‑per‑applicant, align your sourcing strategy, and use automation to keep the data flowing. When the funnel works, hiring becomes less of a gamble and more of a science – and that’s the real north star for any talent team.
Frequently Asked Questions
How do I calculate the conversion rate for each stage of my recruiting funnel?
Divide the number of candidates who move to the next stage by the number in the current stage, then multiply by 100 to get a percentage. Do this for applications to screenings, screenings to interviews, interviews to offers, and offers to hires.
What does the 180-to-1 ratio represent and how is it calculated?
The 180-to-1 ratio means you need roughly 180 applicants to secure one hire. It is calculated by dividing total applicants by total hires, reflecting average industry conversion rates.
Which metrics are most important for lowering cost‑per‑applicant?
Track source‑of‑hire cost, advertising spend per applicant, and time‑to‑fill for each stage. Optimizing high‑cost sources and shortening low‑yield stages reduces overall cost per applicant.
How can recruiting funnel data help me forecast future hiring needs?
By applying your stage conversion percentages to projected applicant volumes, you can estimate how many screenings, interviews, and offers will be needed to meet hiring targets. This allows proactive resource planning and budgeting.
What software options are best for automating recruiting funnel tracking?
Applicant tracking systems (ATS) like Greenhouse, Lever, and SmartRecruiters offer built‑in funnel dashboards. They automatically capture stage transitions, calculate conversion rates, and generate cost‑per‑applicant reports.
