
Recruitment Analytics: A Complete Guide to Data‑Driven Hiring Success
Ever wondered why some teams fill roles in days while others crawl for months? The answer usually lives in recruitment analytics. By turning raw hiring data into clear actions, you can slash time‑to‑fill, trim cost‑per‑hire, and lift the quality of every new hire. In this guide I’ll walk you through the basics, the metrics that matter, the tools you need, and the future‑proof strategies that keep top talent flowing.
What is Recruitment Analytics?
Definition and Core Concept
Recruitment analytics is the practice of gathering, cleaning, and interpreting data from every step of the hiring funnel. Think of it as a compass that points you toward faster, cheaper, and smarter hiring decisions. Instead of guessing which job board works best, you let the numbers speak.
Difference Between Analytics and Reporting
Reporting is about dumping numbers on a dashboard. Analytics digs deeper – it asks why those numbers look the way they do, spots trends, and suggests actions. One reports a 25 % offer acceptance rate; the other explains that candidates from employee referrals accept offers 40 % more often.
Why Recruitment Analytics Matters
Business Impact
Time‑to‑fill shrinks by an average of 20 % when firms act on real‑time data. Cost‑per‑hire can dip below $4,000 for high‑volume roles if you know which source yields the cheapest talent. And quality of hire jumps when you match candidate traits to performance benchmarks. Those three metrics alone can shift the bottom line by millions.
Aligning Hiring with Business Goals
When recruitment analytics ties hiring velocity to product launches, you stop hiring on instinct and start hiring on impact. For example, a fintech startup reduced its go‑to‑market timeline by two weeks after aligning talent pipelines with sprint cycles.
Key Recruitment Metrics & KPIs
Time‑to‑Fill & Time‑to‑Hire
Time‑to‑fill measures days from job requisition to accepted offer; time‑to‑hire tracks from candidate application to acceptance. Both matter, but the latter gives insight into interview efficiency.
Cost‑Per‑Hire
Calculate cost‑per‑hire by adding advertising spend, agency fees, recruiter salaries, and interview costs, then dividing by total hires. A clear formula helps you spot overspend on underperforming channels.
Source‑of‑Hire & Source Conversion Rate
Source‑of‑hire tells you where your talent comes from; source conversion rate shows which sources deliver candidates who actually get hired. You might discover LinkedIn brings the most applicants, but employee referrals bring the highest conversion.
Offer Acceptance Rate
This metric reflects market competitiveness. If your rate slides below 70 %, it’s time to review compensation, employer brand, or the speed of your offer process.
Quality of Hire & Predictive Performance
Quality of hire blends early‑stage performance ratings with retention data. Companies using quality of hire analytics to boost performance often see a 15 % lift in employee productivity within the first year.
Diversity & Inclusion Metrics
Track gender, ethnicity, and veteran status at each funnel stage. Diverse pipelines not only meet compliance goals but also improve innovation scores, according to a 2022 McKinsey study.
Building a Recruitment Analytics Framework
Data Collection
Pull data from your ATS, job board integrations, candidate surveys, and assessment platforms. Even simple Google Forms can capture candidate experience scores that feed into later analysis.
Data Cleaning & Normalization
Messy data kills insight. Standardize date formats, remove duplicates, and map job titles to a common taxonomy. After cleaning, you’ll see trends that were hidden behind inconsistent labeling.
Creating HR Dashboards
Start with a high‑level HR dashboards view—such as the TAD (Dashboard)—that provides headline KPIs, trend lines, and alerts for off‑track metrics. Drill down to source performance or recruiter efficiency with a click.
Establishing Benchmarks & Targets
Benchmarks can be internal (last quarter’s average) or industry‑based. Set SMART targets – for example, “reduce time‑to‑fill for technical roles from 45 to 35 days by Q4.”
Tools & Technologies
Built‑in ATS Analytics
Most modern ATSs ship with basic funnel reports. They’re fine for small teams but often lack predictive capabilities.
Dedicated Recruitment Analytics Platforms
Solutions like Beamery or Eightfold offer deeper segmentation, cohort analysis, and AI‑driven insights. Pricing varies, but ROI can be measured in saved recruiter hours.
AI & Predictive Modeling Solutions
AI engines analyze past hires to forecast which candidates will succeed. Imagine a score—like SmartScore™—that predicts a candidate’s 12‑month performance before the interview even starts.
Integration with broader HRIS & BI tools
Connecting recruitment data to your HRIS, payroll, and BI platforms creates a unified view of talent acquisition and workforce planning. You’ll see how hiring decisions ripple through turnover and productivity.
Best Practices for Effective Analysis
Setting SMART Hiring Goals
Specific, Measurable, Achievable, Relevant, Time‑bound goals keep everyone on the same page. “Hire 20 data scientists by Q3 with a 90 % quality of hire score” is far clearer than “grow the data team.”
Regular Review Cadence
Weekly stand‑ups for recruiters, monthly deep‑dives with finance, and quarterly executive reviews create a rhythm that catches issues early.
Cross‑functional Collaboration
Bringing finance, ops, and HR into the conversation ensures that hiring budgets align with business forecasts. It also surfaces hidden cost drivers, like excessive third‑party agency spend.
Data Governance & Privacy Compliance
Recruitment data falls under GDPR and EEOC rules. Assign data owners, document processing activities, and anonymize personally identifiable information when building aggregate reports.
Advanced Topics Not Covered by Most Competitors
Predictive Recruitment Analytics & AI Forecasting
Predictive analytics can estimate future hiring demand based on sales pipelines, attrition trends, and market conditions. One retail chain used AI forecasting to schedule 30 % fewer seasonal hires without missing sales targets.
ROI Calculation – Turning Metrics into Financial Impact
Assign dollar values to each metric: a day shaved off time‑to‑fill saves recruiter cost; a higher quality of hire reduces turnover expense. Summing these gives a concrete ROI figure you can present to the CFO.
Industry‑Specific Use Cases
In healthcare, healthcare recruitment analytics track credentialing times, nurse‑to‑patient ratios, and specialty shortages. A hospital network used these insights to cut vacancy times for ICU nurses by 28 %.
Common Pitfalls & How to Avoid Them
Over‑reliance on Single Metrics
Focusing only on time‑to‑fill can push you to hire fast but low‑quality talent. Balance speed with quality and cost metrics.
Ignoring Data Quality Issues
Bad data leads to bad decisions. Regular audits and automated validation rules keep your analytics trustworthy.
Lack of Actionable Insights
Numbers without next steps sit idle. Pair each insight with a clear owner and deadline – that’s how you turn analysis into improvement.
Real‑World Success Stories
Case Study Reducing Time‑to‑Fill by 30 % with Dashboard Analytics
A mid‑size tech firm built a live HR dashboards view that highlighted bottlenecks in interview scheduling. Recruiters cut the average interview cycle from 12 to 8 days, delivering a 30 % reduction in overall time‑to‑fill.
Case Study Boosting Quality of Hire through Predictive Scoring
A financial services company adopted an AI scoring model that blended assessment results with past performance data. Within six months, the quality of hire metric rose by 18 % and early turnover dropped from 12 % to 5 %.
Getting Started – A Step‑by‑Step Playbook
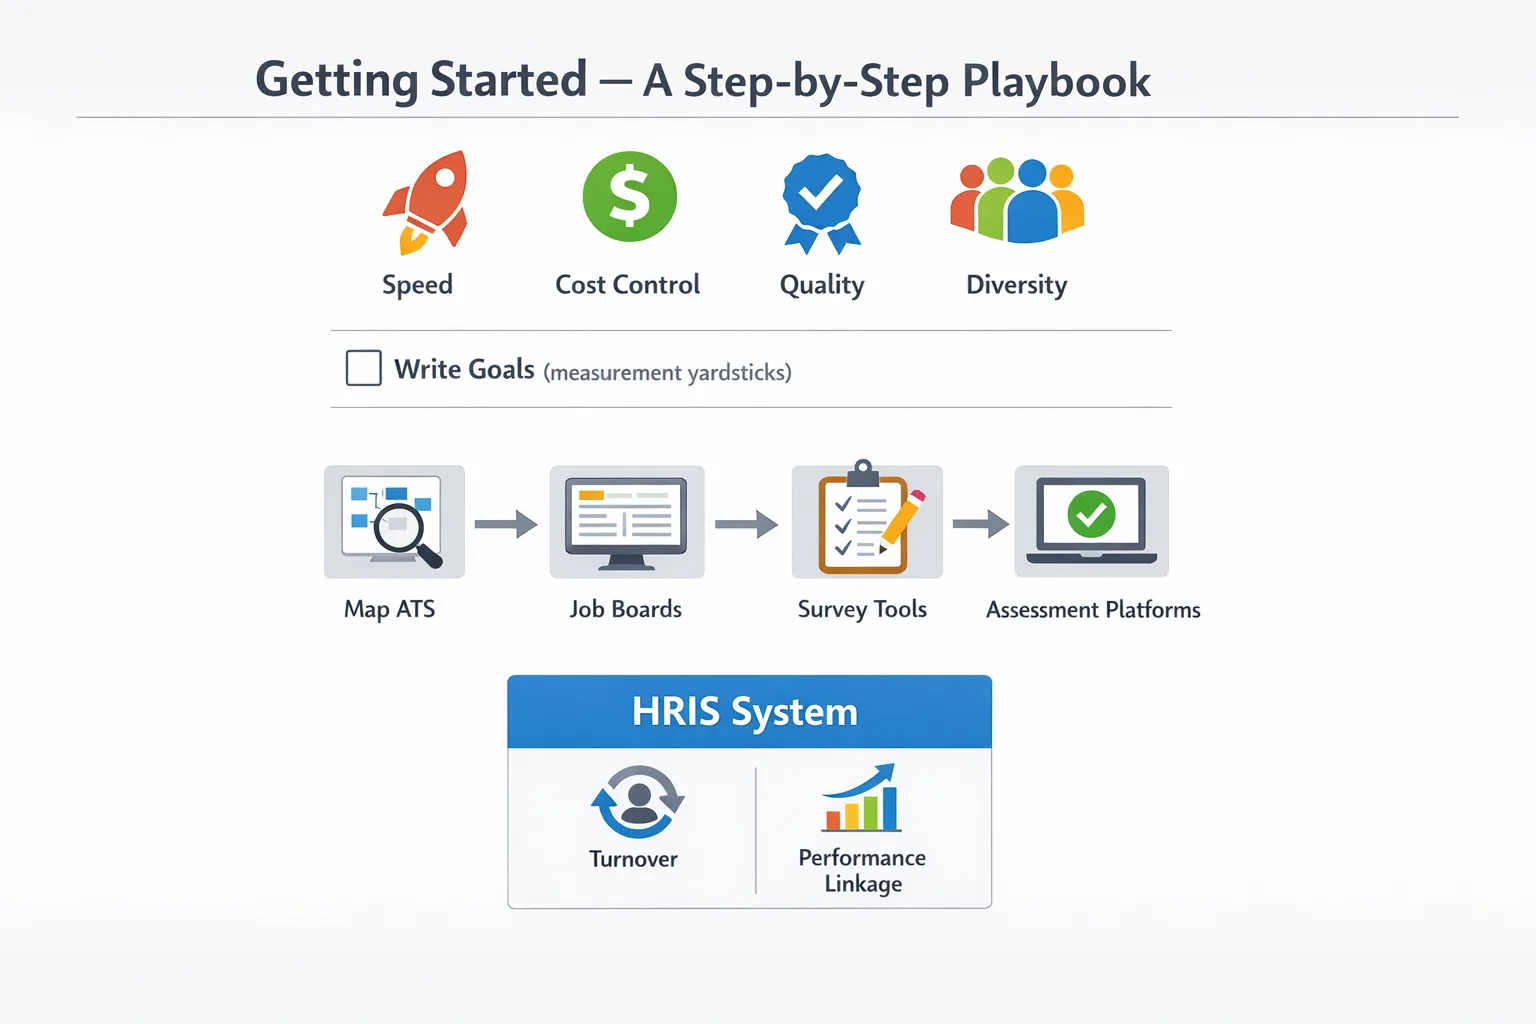
1. Define Objectives
Identify what you need most – speed, cost control, quality, or diversity. Write those goals down; they become your measurement yardsticks.
2. Identify Data Sources
Map your ATS, job boards, survey tools, and assessment platforms. Don’t forget HRIS data for turnover and performance linkage.
3. Choose Metrics & Build Dashboard
Select the KPIs that match your objectives. Use a tool like Power BI or Tableau to craft a visual dashboard that updates automatically.
4. Analyze & Interpret Insights
Look for patterns – high drop‑off rates on a particular job board? Slower offers for certain departments? Turn each pattern into a hypothesis to test.
5. Implement Changes & Measure Impact
Deploy a small experiment – perhaps a new interview template – then track the metric shift. Iterate until you hit your targets.
Future of Recruitment Analytics
Emerging Trends
Machine learning is moving from prediction to prescriptive advice, suggesting optimal interview schedules and compensation packages. Talent market intelligence platforms scrape real‑time salary data, feeding it back into your sourcing strategy.
The Role of Employee Experience Data
Employee NPS, onboarding surveys, and engagement scores are feeding back into recruitment models. A positive candidate experience now correlates with higher retention, making experience data a critical input for future analytics.
Quick Reference Checklist
- Set clear hiring objectives – speed, cost, quality, diversity.
- Map all data sources – ATS, job boards, assessments, HRIS.
- Clean and normalize data before analysis.
- Choose core metrics: time‑to‑fill, cost‑per‑hire, quality of hire, source conversion.
- Build live HR dashboards with alerts for off‑track KPIs.
- Implement predictive models for demand forecasting.
- Calculate ROI by assigning dollar values to metric improvements.
- Review data governance policies for GDPR and EEOC compliance.
- Run monthly cross‑functional review meetings.
- Iterate based on insights and track impact over time.
Now that you have the full playbook, it’s time to put the numbers to work. Start small, stay disciplined, and watch recruitment analytics transform your hiring from a guessing game into a strategic advantage.
Frequently Asked Questions
How do I begin implementing recruitment analytics in my organization?
Start by defining clear hiring goals and the specific questions you want data to answer. Then, identify the data sources you already have (ATS, HRIS, job boards) and map them to key metrics. Choose a reporting platform, set up dashboards, and pilot the process with a single department before scaling.
What software tools are commonly used for recruitment analytics?
Popular options include applicant tracking systems with built‑in analytics (e.g., Greenhouse, Lever), dedicated HR analytics platforms (Visier, Tableau for HR), and data‑integration tools like Power BI or Looker. The best choice depends on your existing tech stack, budget, and the depth of analysis you need.
Which KPIs should I track to improve time‑to‑fill?
Focus on metrics such as average time‑to‑fill per role, stage‑by‑stage cycle time, interview‑to‑offer ratio, and recruiter workload. Analyzing bottlenecks in each hiring stage helps you pinpoint where delays occur and implement targeted process changes.
How can recruitment analytics reduce cost‑per‑hire?
By measuring cost components (advertising spend, agency fees, recruiter time) against source effectiveness, you can reallocate budget to the most efficient channels. Analytics also highlight low‑performing jobs or sources, allowing you to cut waste and negotiate better rates.
Is it possible to predict candidate quality or future performance using recruitment analytics?
Predictive models that combine past hiring data, assessment scores, and employee performance metrics can surface indicators of future success. While no model is foolproof, they can improve hiring decisions when used alongside human judgment and structured interviews.
